


This aggregate information is compiled from claims data filed by insurers. It has not been audited or independently verified and covers all claims based on filings received by the Florida Office of Insurance Regulation as of August 13, 2018. OIR has scheduled one additional data call for Hurricane Irma claims reporting. Companies are required to report on October 15 and OIR will release the aggregate data after the submission. OIR will determine if additional data calls are necessary following the October 15 report.
Total Estimated Insured Losses: $10,455,503,448
| Lines of Business | Number of Claims | Closed Claims (paid) | Closed Claims (not paid) | Number Claims Open | Percent Claims Closed |
|---|---|---|---|---|---|
| Residential Property | 839,570 | 513,367 | 262,275 | 63,928 | 92.4% |
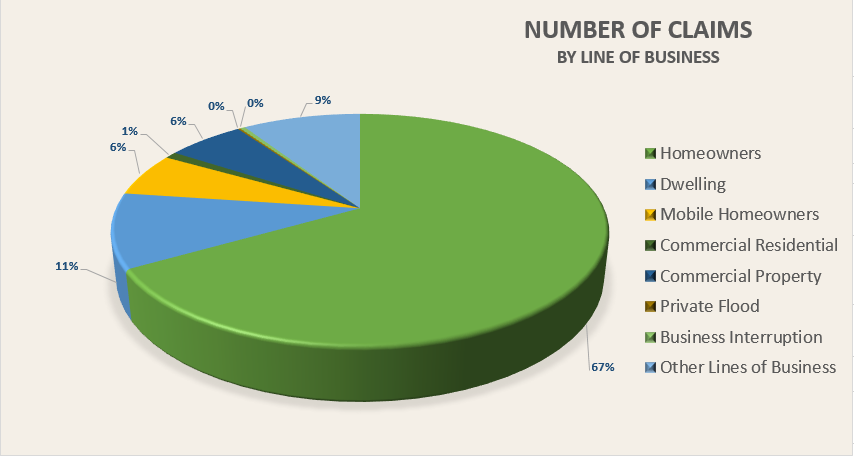
| Homeowners | 665,520 | 398,467 | 215,152 | 51,901 | 92.2% |
| Dwelling | 104,103 | 64,142 | 30,964 | 8,997 | 91.4% |
| Mobile Homeowners | 60,562 | 47,437 | 12,123 | 1,002 | 98.3% |
| Commercial Residential | 9,385 | 3,321 | 4,036 | 2,028 | 78.4% |
| Commercial Property | 59,987 | 19,365 | 25,195 | 15,427 | 74.3% |
| Private Flood | 1,824 | 1,064 | 638 | 122 | 93.3% |
| Business Interruption | 4,004 | 1,798 | 1,788 | 418 | 89.6% |
| Other Lines of Business | 91,852 | 67,644 | 21,654 | 2,554 | 97.2% |
| TOTALS | 997,237 | 603,238 | 311,550 | 82,449 | 91.7% |
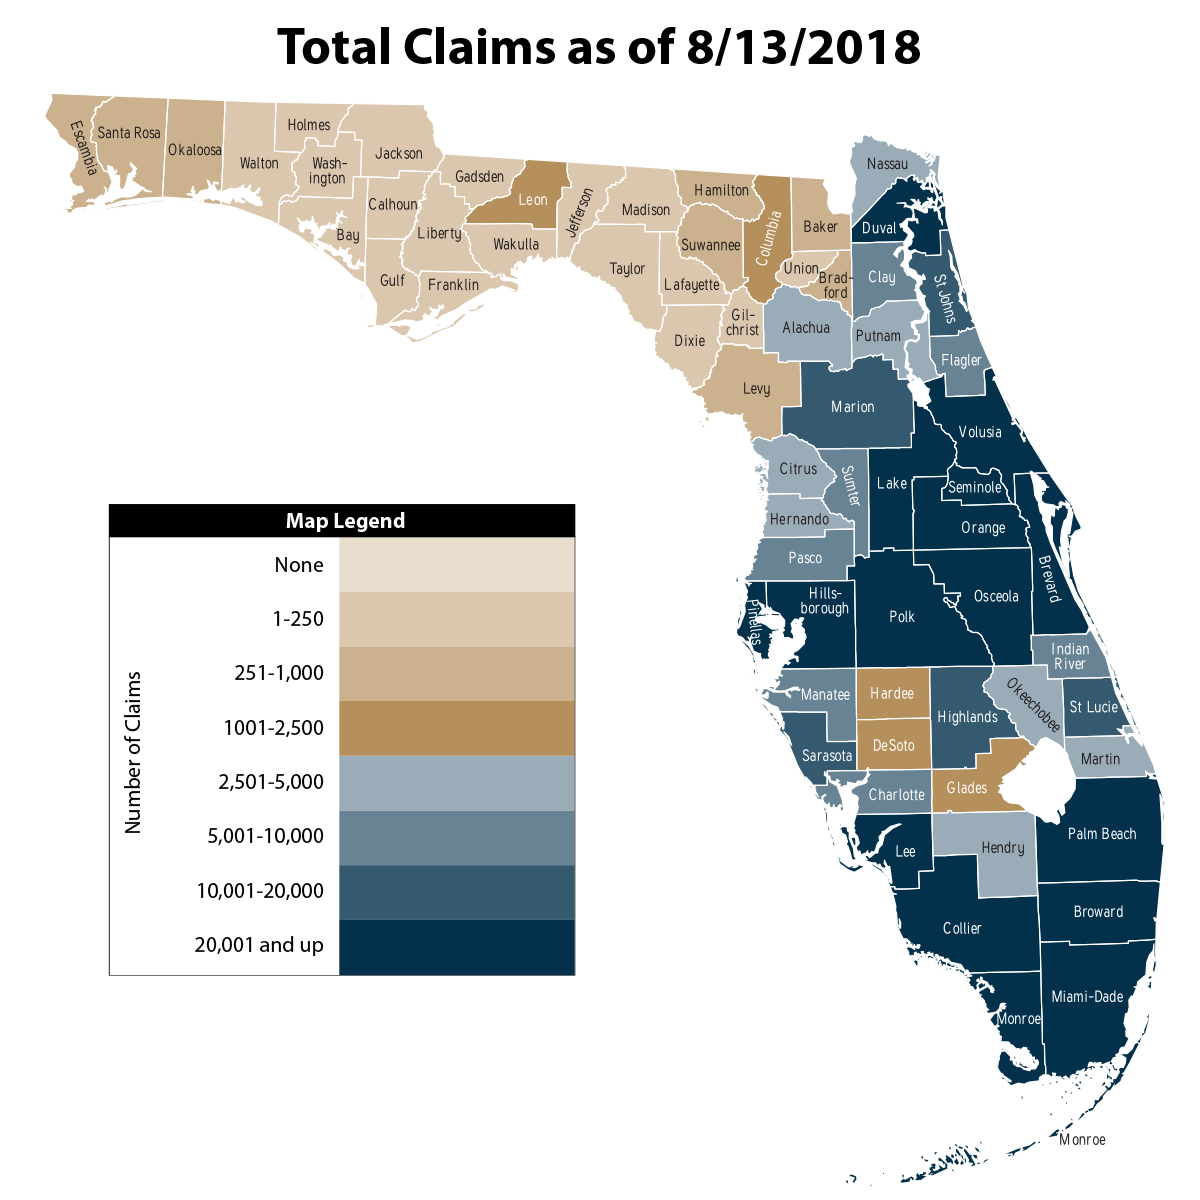
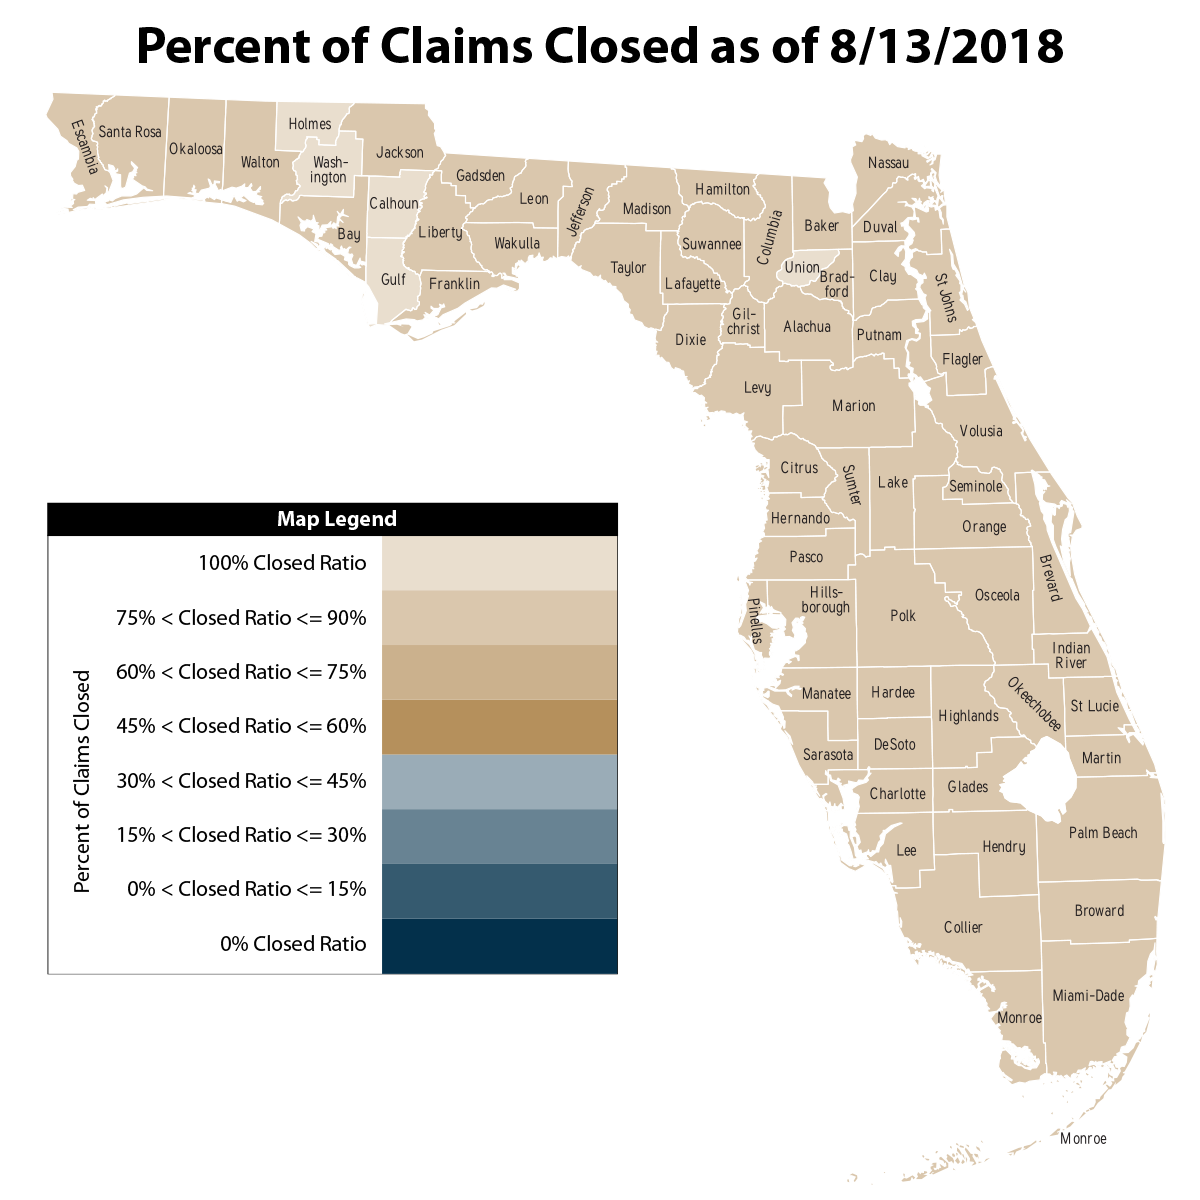
| County | Number of Claims | Closed Claims (paid) | Closed Claims (not paid) | Number Claims Open | Percent Claims Closed |
|---|---|---|---|---|---|
| ALACHUA | 4,226 | 2,337 | 1,764 | 125 | 97.0% |
| BAKER | 567 | 381 | 175 | 11 | 98.1% |
| BAY | 201 | 121 | 72 | 8 | 96.0% |
| BRADFORD | 851 | 497 | 343 | 11 | 98.7% |
| BREVARD | 46,155 | 32,313 | 11,297 | 2,545 | 94.5% |
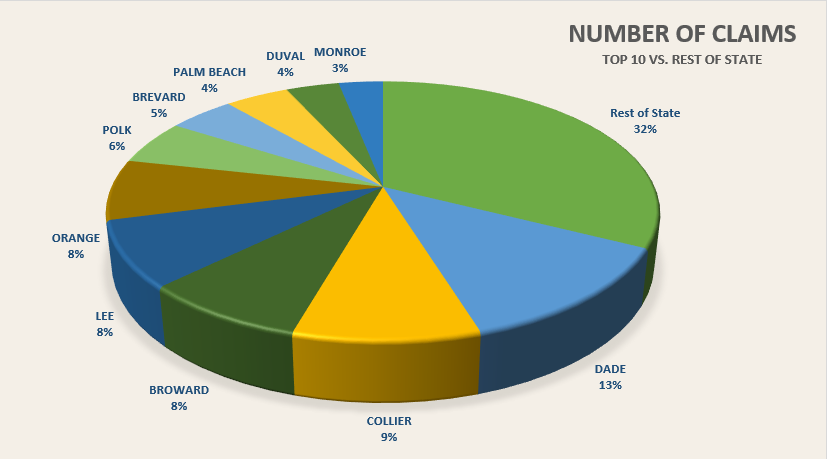
| BROWARD | 82,251 | 42,350 | 28,624 | 11,277 | 86.3% |
| CALHOUN | 25 | 21 | 4 | 0 | 100.0% |
| CHARLOTTE | 8,063 | 4,536 | 3,223 | 304 | 96.2% |
| CITRUS | 2,596 | 1,343 | 1,179 | 74 | 97.1% |
| CLAY | 9,430 | 6,217 | 2,938 | 275 | 97.1% |
| COLLIER | 91,980 | 64,428 | 19,862 | 7,690 | 91.6% |
| COLUMBIA | 1,010 | 631 | 360 | 19 | 98.1% |
| DESOTO | 2,190 | 1,494 | 604 | 92 | 95.8% |
| DIXIE | 233 | 154 | 76 | 3 | 98.7% |
| DUVAL | 37,168 | 22,985 | 12,536 | 1,647 | 95.6% |
| ESCAMBIA | 263 | 158 | 98 | 7 | 97.3% |
| FLAGLER | 6,693 | 4,232 | 2,157 | 304 | 95.5% |
| FRANKLIN | 49 | 24 | 22 | 3 | 93.9% |
| GADSDEN | 202 | 109 | 89 | 4 | 98.0% |
| GILCHRIST | 197 | 134 | 60 | 3 | 98.5% |
| GLADES | 1,140 | 924 | 167 | 49 | 95.7% |
| GULF | 23 | 13 | 10 | 0 | 100.0% |
| HAMILTON | 251 | 184 | 62 | 5 | 98.0% |
| HARDEE | 2,037 | 1,370 | 526 | 141 | 93.1% |
| HENDRY | 3,703 | 2,811 | 695 | 197 | 94.7% |
| HERNANDO | 2,982 | 1,482 | 1,419 | 81 | 97.3% |
| HIGHLANDS | 18,066 | 12,819 | 4,502 | 745 | 95.9% |
| HILLSBOROUGH | 20,641 | 11,052 | 8,661 | 928 | 95.5% |
| HOLMES | 28 | 15 | 13 | 0 | 100.0% |
| INDIAN RIVER | 5,924 | 3,851 | 1,757 | 316 | 94.7% |
| JACKSON | 133 | 76 | 52 | 5 | 96.2% |
| JEFFERSON | 145 | 88 | 46 | 11 | 92.4% |
| LAFAYETTE | 108 | 78 | 28 | 2 | 98.1% |
| LAKE | 24,678 | 16,311 | 7,348 | 1,019 | 95.9% |
| LEE | 81,933 | 51,696 | 24,701 | 5,536 | 93.2% |
| LEON | 1,165 | 653 | 472 | 40 | 96.6% |
| LEVY | 591 | 399 | 177 | 15 | 97.5% |
| LIBERTY | 12 | 7 | 4 | 1 | 91.7% |
| MADISON | 230 | 156 | 70 | 4 | 98.3% |
| MANATEE | 8,888 | 5,190 | 3,396 | 302 | 96.6% |
| MARION | 10,072 | 5,733 | 4,043 | 296 | 97.1% |
| MARTIN | 4,127 | 2,607 | 1,283 | 237 | 94.3% |
| DADE | 126,944 | 62,842 | 40,390 | 23,712 | 81.3% |
| MONROE | 30,969 | 17,852 | 10,487 | 2,630 | 91.5% |
| NASSAU | 4,099 | 2,765 | 1,169 | 165 | 96.0% |
| OKALOOSA | 265 | 163 | 93 | 9 | 96.6% |
| OKEECHOBEE | 3,862 | 3,014 | 689 | 159 | 95.9% |
| ORANGE | 75,495 | 47,668 | 23,384 | 4,443 | 94.1% |
| OSCEOLA | 29,453 | 19,497 | 7,789 | 2,167 | 92.6% |
| PALM BEACH | 44,677 | 24,630 | 16,140 | 3,907 | 91.3% |
| PASCO | 9,252 | 4,764 | 4,183 | 305 | 96.7% |
| PINELLAS | 25,826 | 14,379 | 10,530 | 917 | 96.4% |
| POLK | 55,718 | 38,364 | 15,014 | 2,340 | 95.8% |
| PUTNAM | 3,104 | 2,030 | 990 | 84 | 97.3% |
| SANTA ROSA | 461 | 311 | 139 | 11 | 97.6% |
| SARASOTA | 11,928 | 6,191 | 5,207 | 530 | 95.6% |
| SEMINOLE | 24,790 | 15,045 | 8,538 | 1,207 | 95.1% |
| ST JOHNS | 1,1093 | 6,897 | 3,675 | 521 | 95.3% |
| ST LUCIE | 12,995 | 8,045 | 4,146 | 804 | 93.8% |
| SUMTER | 5,300 | 3,074 | 2,101 | 125 | 97.6% |
| SUWANNEE | 873 | 605 | 243 | 25 | 97.1% |
| TAYLOR | 131 | 78 | 47 | 6 | 95.4% |
| UNION | 192 | 140 | 52 | 0 | 100.0% |
| VOLUSIA | 27,375 | 17,887 | 8,115 | 1,373 | 95.0% |
| WAKULLA | 108 | 62 | 37 | 9 | 91.7% |
| WALTON | 64 | 35 | 28 | 1 | 98.4% |
| WASHINGTON | 33 | 20 | 13 | 0 | 100.0% |
| County Unknown | 11,003 | 4,900 | 3,436 | 2,667 | 75.8% |
| Statewide | 997,237 | 603,238 | 311,550 | 82,449 | 91.7% |
*Leading up to September 20, 2017, the Office reached out to insurers that had asserted trade secret protection on their Hurricane Irma claims data to request they waive that assertion so the Office could publish aggregate county level data to the website. Because the Office obtained enough waivers, we are pleased to report these efforts allow the release of aggregate Hurricane Irma claims date on a county basis.